- Visibility 29 Views
- Downloads 13 Downloads
- DOI 10.18231/j.achr.2020.047
-
CrossMark
- Citation
Comparative evaluation of fibroscan, liver biopsy and non-invasive serum markers for assessment of hepatic fibrosis in chronic liver disease
- Author Details:
-
Nisha Marwah
-
Renuka Verma *
-
Gurupriya J
-
Praveen Malhotra
-
Sumiti Gupta
Introduction
Chronic liver disease is the leading cause of morbidity and mortality worldwide. Different types of injuries start wound healing process in liver that progress through various pathological stages varying from mild hepatitis, inflammation without fibrosis to advanced fibrosis and cirrhosis. Conditions associated with chronic liver disease are extensive including, viral (hepatitis B, hepatitis C), toxins and drugs (alcoholic liver disease), metabolic (non-alcoholic fatty liver disease, haemochromatosis, Wilson’s disease) and autoimmune hepatitis.[1]
In patients with chronic liver disease it is important to assess the presence and degree of hepatic fibrosis for diagnosis, treatment and follow up.[2] Liver biopsy is the oldest method and gold standard for evaluation of liver histology and progression of chronic liver disease. But it has several negative aspects as it is costly, time consuming and invasive with risk of complications such as mild abdominal pain, severe hemorrhage and injury to the biliary system. Adequate interpretation of the specimen requires a pathologist with expertise in hepatopathology. In medical terms the most important drawback is its substantial sampling variability as biopsies from different areas have shown different stages of fibrosis because an optimally sized biopsy contains 5–11 complete portal tracts and reflects only 1/50000 the volume of the liver.[3]
Due to the above mentioned drawbacks of liver biopsy, several other methods have been proposed to noninvasively stage liver fibrosis including a range of biochemical tests and a variety of imaging modalities.
The non-invasive biomarkers can be measured in outpatient departments, are less costly, can be repeated easily for confirmation, follow-up and monitoring. Due to the poor accuracy of individual markers to assess liver fibrosis, algorithms have been developed by combining panels of markers. However, most of these panels include markers likely to be affected by inflammation in the liver than fibrosis. Also they have low accuracy in detecting intermediate stages of fibrosis compared to cirrhosis.[4]
Fibroscan is a non-invasive test that assesses liver stiffness by employing vibration-controlled transient elastography to emit a shear wave through the liver and measure velocity via ultrasound. Fibroscan is not painful, non-invasive and less expensive. The results are available within 10 minutes and it evaluates 100 times more liver volume than liver biopsy. Thus, it is definitely an advantageous tool over liver biopsy and non-invasive marker panels. Despite the wide acceptance it also has limitations. Acute liver injury, congestive heart failure and postprandial measurement can be associated with an over assessment of liver stiffness.[5]
In present study we have compared the fibrosis assessment done by liver biopsy, serum biomarkers and fibroscan.
Materials and Methods
Case selection
The present prospective study was conducted in the Department of Pathology at Pt. B. D. Sharma, PGIMS, Rohtak over the period of two years. The study comprised a total of thirty consecutive patients suspected to be suffering from chronic liver disease on basis of clinical features, radiological imaging and laboratory investigations.
Fibroscan assessment
Fibroscan was performed in these patients and cases showing Liver stiffness measurement of 7kPa to 13kPa were subjected to liver biopsy to assess the degree of fibrosis.
Morphological evaluation
Each liver biopsy specimen was fixed in formalin, routinely processed for histology, sectioned, and stained with Haemotoxylin and Eosin. The sections were examined in detail for diagnostic features of chronic liver disease. Fibrosis was assessed with the masson trichrome stain, reticulin stain, and van gieson stain. Grading was done by Modified activity grading system and staging of fibrosis was done using Ishak staging system.[6]
Non-invasive Biomarker analysis
Various serum markers and scoring systems were used in this study4
AST/ALT ratio (AAR)
AST/ALT ratio less than 1 (rules out significant fibrosis)
AST/ALT ratio between 1-2 (possibility of fibrosis)
AST/ALT ratio >2 ( significant fibrosis).
AST/platelet ratio index (APRI)
{(AST level/AST upper level of Normal) / platelet counts(109/litre)}× 100
APRI <0.5 (no significant fibrosis and cirrhosis)
APRI between 0.51-1.5 (possibility of fibrosis).
APRI values >1.5 (significant fibrosis).
FIB-4 index:
[age × {AST level/platelet count (109/litre) }× (ALT)1/2]
FIB-4 index less than 1.45 (no significant fibrosis)
FIB4 index between 1.45 – 3.25 (possibility of fibrosis cannot be ruled out)
FIB4 index >3.25 (significant fibrosis).
Forn Index
Forns' index was calculated by applying the following regression equation: 7.811 − 3.131 ln (platelet count (109/L)) + 0.781 ln (γGT (IU/L)) + 3.467 ln (age (y)) − 0.014 ln(cholesterol (mg/dL)).
Forn index <4.2 (No significant fibrosis).
Forn index 4.2-6.9 (Possibility of fibrosis cannot be ruled out).
Forn index >6.9 (Significant fibrosis).
Statistical Analysis
The data was entered and coded in MS Excel spread-sheet. The data was analysed using SPSS (Statistical Package for Social Sciences) software version 20.0 for windows. The results obtained were interpreted and descriptive statistics (mean, standard deviation, range, percentages) were applied wherever appropriate. Where the data was qualitative, chi square test was used to assess the association between these parameters. Area under receiver operator characteristic curve (AUROC) for the various serum markers was calculated and their correlation with fibrosis was seen. A value of p <0.05 was taken as significant.
Results
A total of thirty patients with chronic liver disease due to any etiology including chronic hepatitis B, chronic hepatitis C, alcoholic liver disease, non-alcoholic fatty liver disease, autoimmune hepatitis etc. from the gastroenterology ward/OPD were included in the study. Patients were in the age range of 16 to 60 years with mean age of 41.97±10.80 years. The study comprised 21 (70%) male and 09 (30%) female patients.
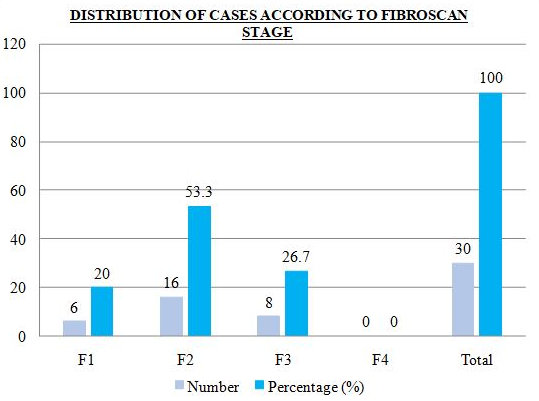
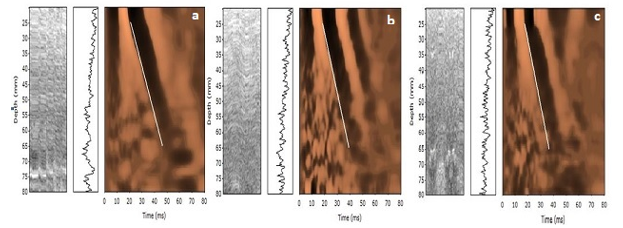
Distribution of cases according to fibroscan stage is shown in [Figure 1], [Figure 2]. Fibrosis stage 2 was seen in 53.3% cases and stage 3 was seen in 26.7% cases.
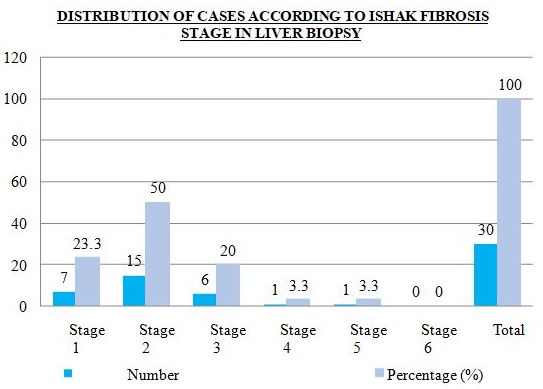
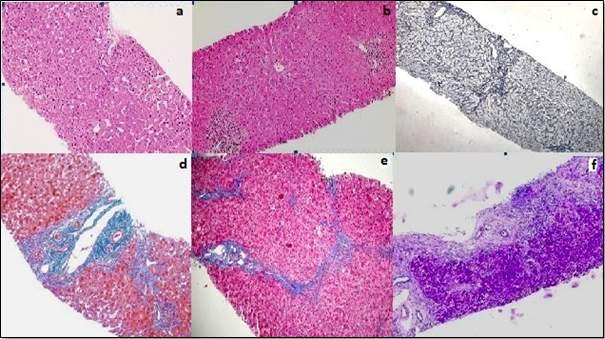
Distribution of cases according to ishak fibrosis stage in liver biopsy is shown in [Figure 3], [Figure 4]. Fifty percent of cases (50%) were in fibrosis stage 2, 23.3% cases in stage 1, 20% cases in stage 3 and 3.3 percent cases each in stage 4 and stage 5.
Distribution of cases according to various scoring system of non-invasive biomarkers is shown in [Table 1], [Table 2], [Table 3], [Table 4].
The association of Fibrosis in liver biopsy and fibroscan was statistically significant with chi square of 4.508 and p-value of 0.0469 as shown in [Table 5].
Comparison of fibroscan and biomarkers: Among various scoring system association of APRI and fibroscan was statistically significant with chi square = 6.800 and p-value of 0.0269 as shown in [Table 6]. However, the association of AAR, FIB-4 and Forn index with fibroscan were found to be statistically non significant with chi square of 5.385, 8.020, 4.560 and p value of 0.969, 0.669, & 0.889.
Comparison of liver biopsy and biomarkers: Among various scoring system association of FIB-4 index and liver biopsy was statistically significant with chi square = 3.850 and p-value of 0.0369 as shown in [Table 7]. The association of AAR, APRI and Forn index with liver biopsy were found to be statistically not significant with chi square of 5.385, 7.980, 9.001 and p value of 2.560, 0.5669 & 0.989.


|
AST/ALT RATIO |
Number |
Percentage (%) |
|
<1 |
27 |
90 |
|
1-2 |
03 |
10 |
|
>2 |
00 |
00 |
|
Total |
30 |
100 |
|
APRI |
Number |
Percentage (%) |
|
<0.5 |
11 |
36 |
|
0.51 – 1.5 |
16 |
53.3 |
|
>1.5 |
3 |
10.0 |
|
Total |
30 |
100 |
|
FIB4 INDEX |
Number |
Percentage (%) |
|
<1.45 |
18 |
60 |
|
1.46 -3.25 |
11 |
36.7 |
|
>3.25 |
1 |
3.3 |
|
Total |
30 |
100 |
|
FORN Index |
Number |
Percentage (%) |
|
< 4.2 |
12 |
40 |
|
4.2 – 6.9 |
09 |
30 |
|
>6.9 |
00 |
00 |
|
NA |
09 |
30 |
|
Total |
30 |
100 |
|
Ishak Fibrosis Stage |
Fibroscan stage |
Total (no of cases) |
|||
|
|
F1 (6-8.kPa) |
F2 (8.6-11.5 kPa) |
F3 (11.6-14 kPa) |
F4 ( >14 kPa) |
|
|
Stage 1 |
4 |
1 |
2 |
0 |
07 |
|
Stage 2 |
2 |
10 |
3 |
0 |
15 |
|
Stage 3 |
0 |
4 |
2 |
0 |
06 |
|
Stage 4 |
0 |
1 |
0 |
0 |
01 |
|
Stage 5 |
0 |
0 |
1 |
0 |
01 |
|
Stage 6 |
0 |
0 |
0 |
0 |
00 |
|
Total |
06 |
16 |
08 |
00 |
30 |
|
Fibroscan stage |
APRI( AST PLATELET RATIO INDEX) |
Total (no of cases) |
||
|
|
APRI < 0.5 |
APRI - 0.5 – 1.5 |
APRI - >1.5 |
|
|
F1 (6-8.5 kPa) |
4 |
2 |
0 |
6 |
|
F2(8.6-11.5kPa) |
5 |
11 |
0 |
16 |
|
F3(11.6-14 kPa) |
2 |
3 |
3 |
8 |
|
F4( >14 kPa) |
0 |
0 |
0 |
0 |
|
Total |
11 |
16 |
3 |
30 |
|
Ishak Fibrosis Stage |
FIB-4 INDEX |
Total (no of cases) |
||
|
|
FIB-4 Index < 1.45 |
FIB-4 Index - 1.45 – 3.25 |
FIB-4 Index > 3.25 |
|
|
Stage 1 |
05 |
02 |
00 |
07 |
|
Stage 2 |
07 |
08 |
00 |
15 |
|
Stage 3 |
05 |
00 |
01 |
06 |
|
Stage 4 |
01 |
00 |
00 |
01 |
|
Stage 5 |
00 |
01 |
00 |
01 |
|
Stage 6 |
00 |
00 |
00 |
00 |
|
Total |
18 |
11 |
01 |
30 |
Discussion
In patients with chronic liver disease it is important to assess the presence and degree of hepatic fibrosis in order to make therapeutic decision as fibrosis is a dynamic process and is reversible with the use of recent anti-fibrotic therapies.[7]
Our study included thirty cases of chronic liver disease. The patient’s age ranged from 16 – 60 years. Thirty three percent (33%) of the cases belonged to age group of 51-60. The sample size was comparable to study conducted by Maklad et al [8] while most of the other studies had a larger sample size.
The fibroscan results of our study were comparable to the study done by Munoz R et al [9] with majority of cases under stage 1 and 2, while in other studies [10], [11] there was wide distribution of cases amongst various stages.
In our study Ishak fibrosis staging was used to assess liver fibrosis while in other studies Staging and grading of liver biopsies were done using METAVIR stage.[10], [11], [12] Ishak and METAVIR are nearly identical; Ishak is of a wider scale. As compared to METAVIR stage which is a four point staging system, Ishak staging is a 6- point staging system, it is more accurate for the assessment of fibrosis as fibrous expansion of portal-portal and portal-central septa and bridging fibrosis are more elaborate in case of Ishak staging.[13] However, the distribution of cases in their studies were similar to that in our study using conversion table with majority of the cases falling under stages 1 and 2, except for the study by Kim et al [10] which had majority of cases in stage 4.
In the study done by Munoz R et al [9] there was significant association between fibroscan results and liver biopsy in mild fibrosis and severe fibrosis stage, while it was difficult to analyse in intermediate fibrosis stages by fibroscan. In comparison, our study comprised majority of patients in intermediate fibrosis stage and there was significant association between ishak fibrosis stage and fibroscan through all the stages.
Although in our study there was association between fibroscan and Ishak fibrosis stage, the association of most of the non-invasive serum markers with fibrosis stage was not very satisfactory. This may be due to the smaller sample size of our study. Studies [14], [15] which had a larger sample size showed significant association between these parameters. In addition, there was non availability of certain parameters such as GGT for the calculation of forn index due to which results were not very significant.
Strengths and limitations
It was a prospective study, hence we recorded various clinical and laboratory parameters for calculation of various non- invasive markers. We also made an attempt to validate the role of an array of non invasive markers rather than evaluating the role of a single marker.
However, number of cases in our study were less; hence the results of our study need to be validated in larger, multicentric trials. We evaluated simple non-invasive scoring systems only related to the assessment of fibrosis, but markers indicative of inflammatory or apoptotic activity were not tested which if done could have improved the overall assessment.
Conclusion
In our study, fibroscan had the most superior diagnostic accuracy in the estimation of fibrosis through all stages as compared to other non-invasive serum markers and accuracy of fibroscan in evaluating fibrosis is comparable to that of liver biopsy. Thus, liver biopsy can be replaced with fibroscan in the future.
The simple noninvasive scoring systems evaluated in the present study have a role in assessment of fibrosis and can identify patients at higher risk for development of liver related complications and higher overall mortality. The major advantage of using any of these simple scoring systems is that they are derived from readily available clinical and laboratory indices. Furthermore, a combination of these simple noninvasive markers may perform better than each alone.
Source of Funding
None.
Conflict of Interest
None.
References
- V Kumar, A K Abbas, J C Aster, J A Perkins. Gallbladder, and Biliary tract. Robbins Basic Pathology 2013. [Google Scholar]
- S Sherlock, J Dooley, Oxford: Blackwell Science. Wilson disease. In Diseases of the Liver and Biliary System. . [Google Scholar]
- S E Saadany, H Soliman, D H Ziada, M Hamisa, M Hefeda, A Selim. Fibroscan versus liver biopsy in the evaluation of response among the Egyptian HCV infected patients to treatment. Egy J Nucl Radiol Nucl Med 2016. [Google Scholar]
- H I Fatallah. Noninvasive Biomarkers of Liver Fibrosis: An Overview. Adv Hepatol 2012. [Google Scholar]
- N H Afdhal, Fibroscan. Transient Elastography) for the measument of liver fibrosis. Gastroenterol Hepatol 2012. [Google Scholar]
- K Ishak, A Baptista, L Bianchi. Histological grading and staging of chronic hepatitis. J Hepatol 1995. [Google Scholar]
- K Zhou, G L Lu. Assessment of fibrosis in chronic liver diseases. J Dig Dis 2009. [Google Scholar]
- S Maklad, E Hassan, M Attalah, A A Zeid. Liver Biopsy and FibroScan to Detect Early Histopathological Changes in Chronic HBV Patients Not Candidate for Treatment. Gastroenterol Res 2014. [Google Scholar]
- R. Muñoz, E. Ramírez, I. Fernandez, A. Martin, M. Romero, E. Romero. Correlation Between Fibroscan, Liver Biopsy, and Clinical Liver Function in Patients With Hepatitis C Virus Infection After Renal Transplantation. Transplant Proceed 2009. [Google Scholar]
- S U Kim, K J Kim, N Y Park, H K Han. Discordance between Liver Biopsy and FibroScan in Assessing Liver Fibrosis in Chronic Hepatitis B: Risk Factors and Influence of Necroinflammation. Plos one 2012. [Google Scholar]
- A H K Abdelmaksoud, M El_Sayed Taha, M El Kassas, R E Mahdy, G El-Din Esmat Mohamed, H A Samy. Prospective comparison of transient elastography and liver biopsy for the assessment of fibrosis in chronic hepatitis C infection. Egy J Radiol Nucl Med 2015. [Google Scholar]
- M S Elzawawya, S A Hassaneina, Rme Nomrosy. The role of fibroscan in assessment of liver cirrhosis in patients with chronic liver disease. Menoufia Med J 2018. [Google Scholar]
- L M Jones, J D Bancroft, M Gamble, S K Suvarna, C Layton, J D Bancroft. Connective tissues and stains. Theory and practice of histological techniques 2011. [Google Scholar]
- W Y Tan, B X Zhou, Y Ye, C He, H G Ge. Diagnostic value of FIB-4, aspartate aminotransferase-to-platelet ratio index and liver stiffness measurement in hepatitis B virus-infected patients with persistently normal alanine aminotransferase. World J Gastroenterol 2017. [Google Scholar]
- H Xu, W Kong, L Liu, X Chi, X Wang, R Wu. Accuracy of M2BPGi, compared with FibroScan, in analysis of liver fibrosis in patients with hepatitis C. Gastroenterol 2017. [Google Scholar]
